Projects

Projects and prototypes.

Each one opens with what it does, then the problem, how I built it and the result.

Live demo · Risk · Maps

How close is each home to a fault line?

1,000 California homes, rated red, yellow or green by distance to the nearest fault.

Problem
A buyer looking at a pool of California mortgages wanted to know how many homes sat close to a fault line, and the answer had to be ready by morning.
Approach
Clean each address, turn it into map coordinates, measure the straight-line distance to the nearest mapped fault and rate the home. Sliders set the red and yellow cutoffs and which faults count.
Result
Tap any home on the map to follow it from messy address to rating.
Live demo · FP&A

Revenue forecast planner

A working version of the kind of revenue forecast and capacity plan I build, with numbers you can change.

Problem
Planning stalls when the forecast lives in a spreadsheet only one person understands, and the question “when do we need another printer?” gets answered too late.
Approach
One page for a 3D-printing lab. Organic growth compounds, new accounts ramp up over three months, a price increase starts in the month you pick, and three scenarios run side by side. Utilization is checked against an 85% planning line.
Result
Every number updates as you move an input, and the model names the month you would need another printer. The math lives in one small, readable function in the page source.
Live demo · BI

Quality dashboard prototype

A remake-rate dashboard of the kind a manufacturing lab uses to spot quality problems early, across 24 months.

Problem
Remakes cost material and machine time, and a single monthly total hides which product and which reason drive them.
Approach
KPI tiles with change against the prior period, a Pareto chart of remake reasons, a by-product table, and a trend line against a 3% target that marks the month a new design check went live. Filter by product and by 3, 6 or 12 months.
Result
In one glance you can see the few reasons behind most remakes and whether the design check moved the rate.
Open source · Python

Job alert tool

A Python app that reads company job boards directly every hour, so I hear about a matching role soon after it goes live.

Problem
Job aggregators re-list postings hours or days after a company publishes them, and I wanted to apply within hours.
Approach
Fetchers for Greenhouse, Lever, Ashby and Workday boards; a seen-jobs store (SQLite or Postgres) so only new postings alert, with a quiet first run; filters for title, location and freshness; an optional 0 to 100 fit score from Claude; email or phone alerts, best match first.
Result
It runs hourly on GitHub Actions, with a test suite that needs no network.
How it works
Company listcompanies.csv
→
FetchersGreenhouse · Lever · Ashby · Workday
→
Seen jobsis this new?
→
Filterstitle · location · age
→
Fit scoreClaude, optional
→
Alertemail or phone push

Built with Python, requests, SQLite/Postgres, pytest and GitHub Actions.

Data graphic

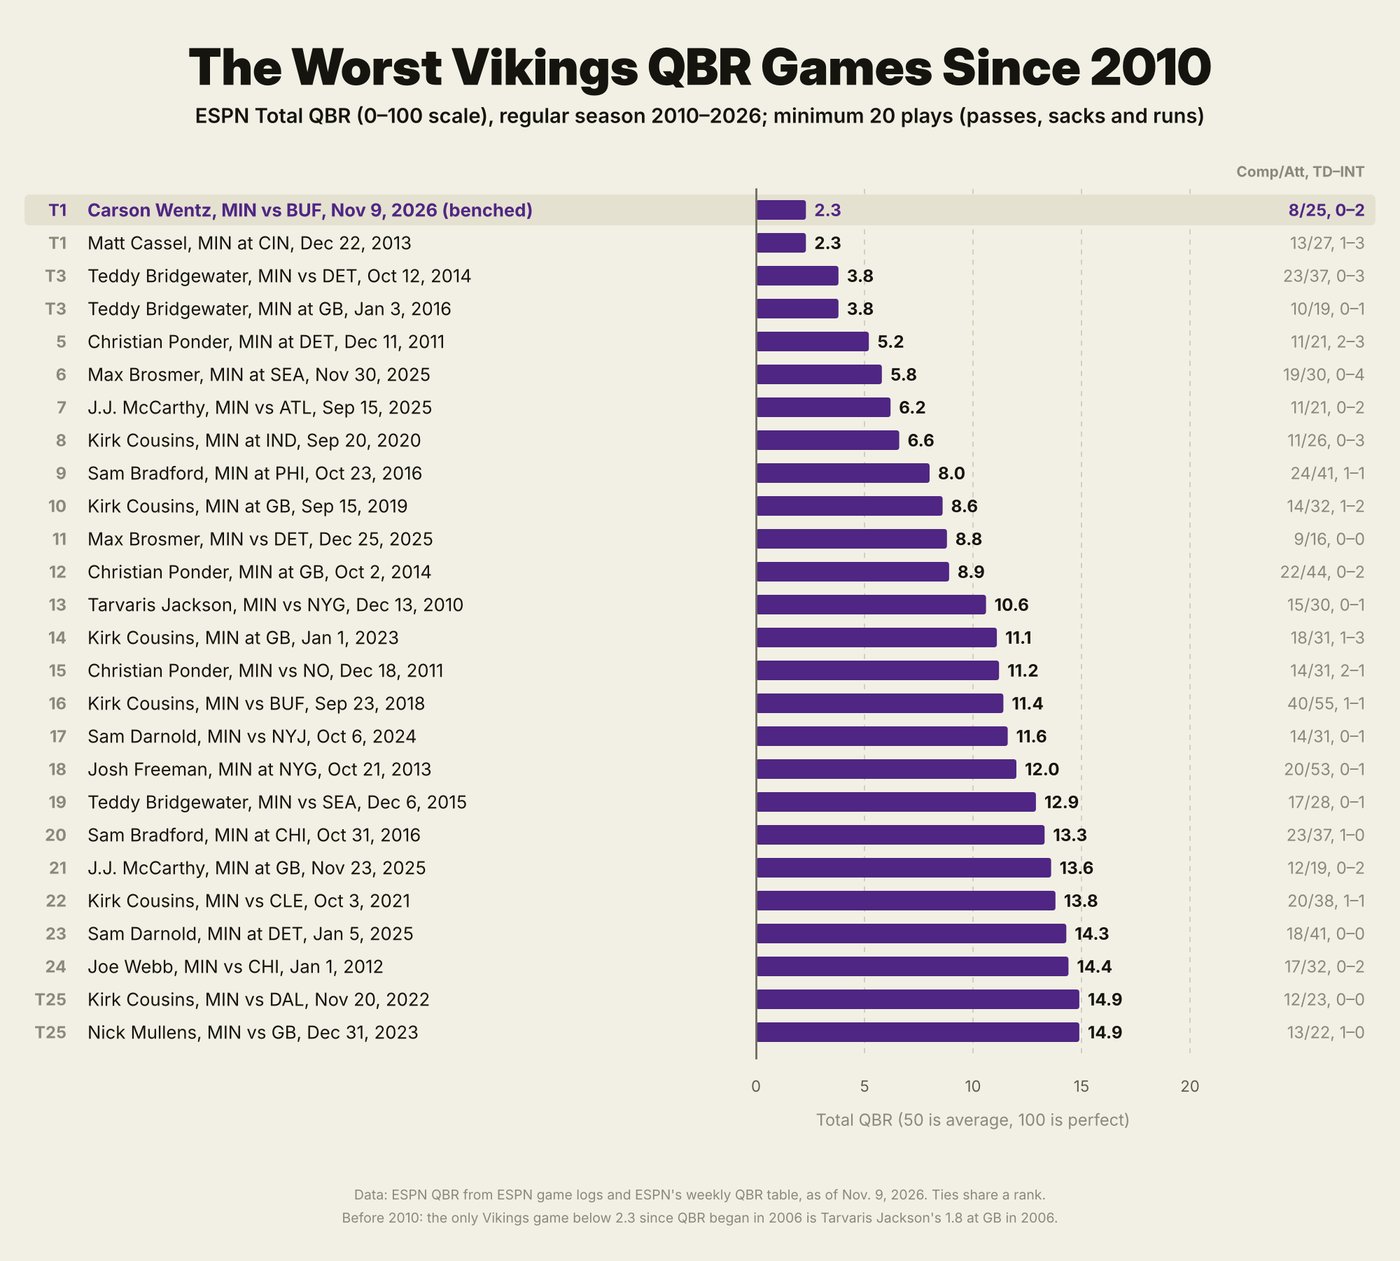
The worst Vikings QBR games since 2010

A ranked chart of the 26 worst Minnesota Vikings quarterback games by ESPN Total QBR, made the week it happened.

Problem
After a rough Sunday in November 2026 I wanted to know where it ranked.
Approach
Pulled ESPN Total QBR from game logs, kept regular-season games with at least 20 plays, ranked them with ties sharing a rank, and designed the chart so the newest game stands out.
Result
Carson Wentz against Buffalo on Nov 9, 2026 tied Matt Cassel’s 2013 game at Cincinnati for the lowest, a QBR of 2.3. It’s the start of a side project: sports graphics built from data, one team first.
Bar chart of the 26 worst Minnesota Vikings QBR games since 2010. Carson Wentz against Buffalo on Nov 9, 2026 ties Matt Cassel's 2013 game at Cincinnati for the lowest, a QBR of 2.3.
Data: ESPN Total QBR, regular season 2010 to 2026, as of Nov 9, 2026
Built at work

Systems I built as a decision support analyst

These are internal tools, so there are no screenshots or data here. I’m happy to walk through how they work in an interview.

Reporting database and nightly ETL

One database joining finance, sales, shipping, customer service, design and manufacturing data, loaded nightly from SQL Server into PostgreSQL so reports keep running when a source system is down.

Internal operations platform

A Python, FastAPI and PostgreSQL web app with modules for collections, remakes, workload and case tracking.

Prescription-to-printer automation

Takes a submitted appliance prescription through check-in, design, QC and nesting onto the 3D printers with no human touch until after printing.

Scan station and inventory

A barcode station that logs technician tasks for labor-efficiency reporting, plus the lab’s first inventory system with lot number tracking.

Automated reporting

Monthly revenue, bi-weekly intake and quarterly shipment reports that run on their own, and Claude skills for recurring analysis.

Personal builds

Things I made for myself

Side projects are where I try new tools before I need them at work.

Printed daily brief

A Python pipeline that turns my notes, calendar, reminders, market closes, scores and weather into a print-ready newspaper that prints at home each morning, with a daily crossword generator.

Triathlon training app

Merges Garmin and Apple Watch data into a live training dashboard. A planner script builds each next session from recent workouts and the plan, then pushes it to workout apps and equipment.

Demos run on illustrative data.